Philips Lighting
In 2017, the Philips Lighting research team was re-envisioning the way social media analytics from Instagram and online news media sites could be aggregated into an informative dashboard that provides insights to owners of large lighting structures across the world, such as bridges in San Francisco and an arena in Madrid. These insights show owners how effective their lighting structures are at engaging social media users.

I led the design of the Sentiment Analytics Dashboard for Philips Research Team in Cambridge, MA for Desktop, iOS, Android, and Mobile Enabled Web compatibility. I defined the design and addressed customer pain-points related to providing social media insights in a valuable way to our target users.
Customer Insights & Ideation
I partnered with one project manager, one developer, and one other lead designer to uncover insights and translate concepts into features that address customer behaviours and motivations.
Experience Strategy & Vision
I created frameworks and prototypes to share the vision, design principles and content strategy. This helped to evangelise ideas, gain alignment and drive decision making.
Planning & Scope Definition
I defined the product with my project manager partners. I evangelized customer goals and balanced business goals. I prioritized and negotiated features for launch and beyond.
Design Execution & Validation
I designed wireframes with responsive design principles in mind for Desktop and Mobile Enabled Web. the I executed journeys, flows, and wireframes.
Leadership
I designed up and presented works to gain buy‐in from senior stakeholders.

Create Deeper Relationships with Customers
Customers of Philips are long-term clients who use a variety of applications that Philips provides. They are loyal customers because of the reliable quality of Philips services. Philips Research team saw an opportunity to create a product that would serve customers’ desires to learn more about the lighting structures they control. The challenge was to create a product that deepened the relationship with customers.

The multi-step UX Research and Design process involved multiple business and design stakeholders. Besides the methods listed above, scenario building and collaboration amongst team members were also heavily taken into consideration. My method is influenced by IDEO's design research model to define, ideate, build, test, and implement a design solution that is accessible, inclusive, and helps users succeed at completing the actions that they would like to complete as easily as possible.
PHASE ONE
Heuristic Review
The heuristic review was completed to identify usability problems on the current dashboard. Some user pain points I found were that unhelpful redundancies were appearing across pages of the original design and that these data points on the dashboard could be consolidated to provide users with a more reliable user experience across the flow.
Requirement Gathering
Arguably one of the most important user research methods is requirement gathering. My approach to requirement gathering involves stakeholder interviews. In gathering the design requirements for the project it is also important to consider the technical history of the product, so that I can design a solution that takes the whole flow into account. An effective requirement gathering exercise gives me a clear picture of what I will be designing for and what features to include.
Competitive Analysis
When approaching a design solution, I always first survey the market and implement diligent market research to inform my design. This step of the process is important because quickly we learn what user expectations are across brandname products. For example, in this competitive analysis, I found that best-in-class meeting platforms usually provided a one-click "join meeting" solution by providing a button on the homepage. This had become the design expectation and ideal for users; therefore, we needed to provide an even simpler solution than the one that arose to the top in the competitive analysis.

PHASE TWO
Sketching
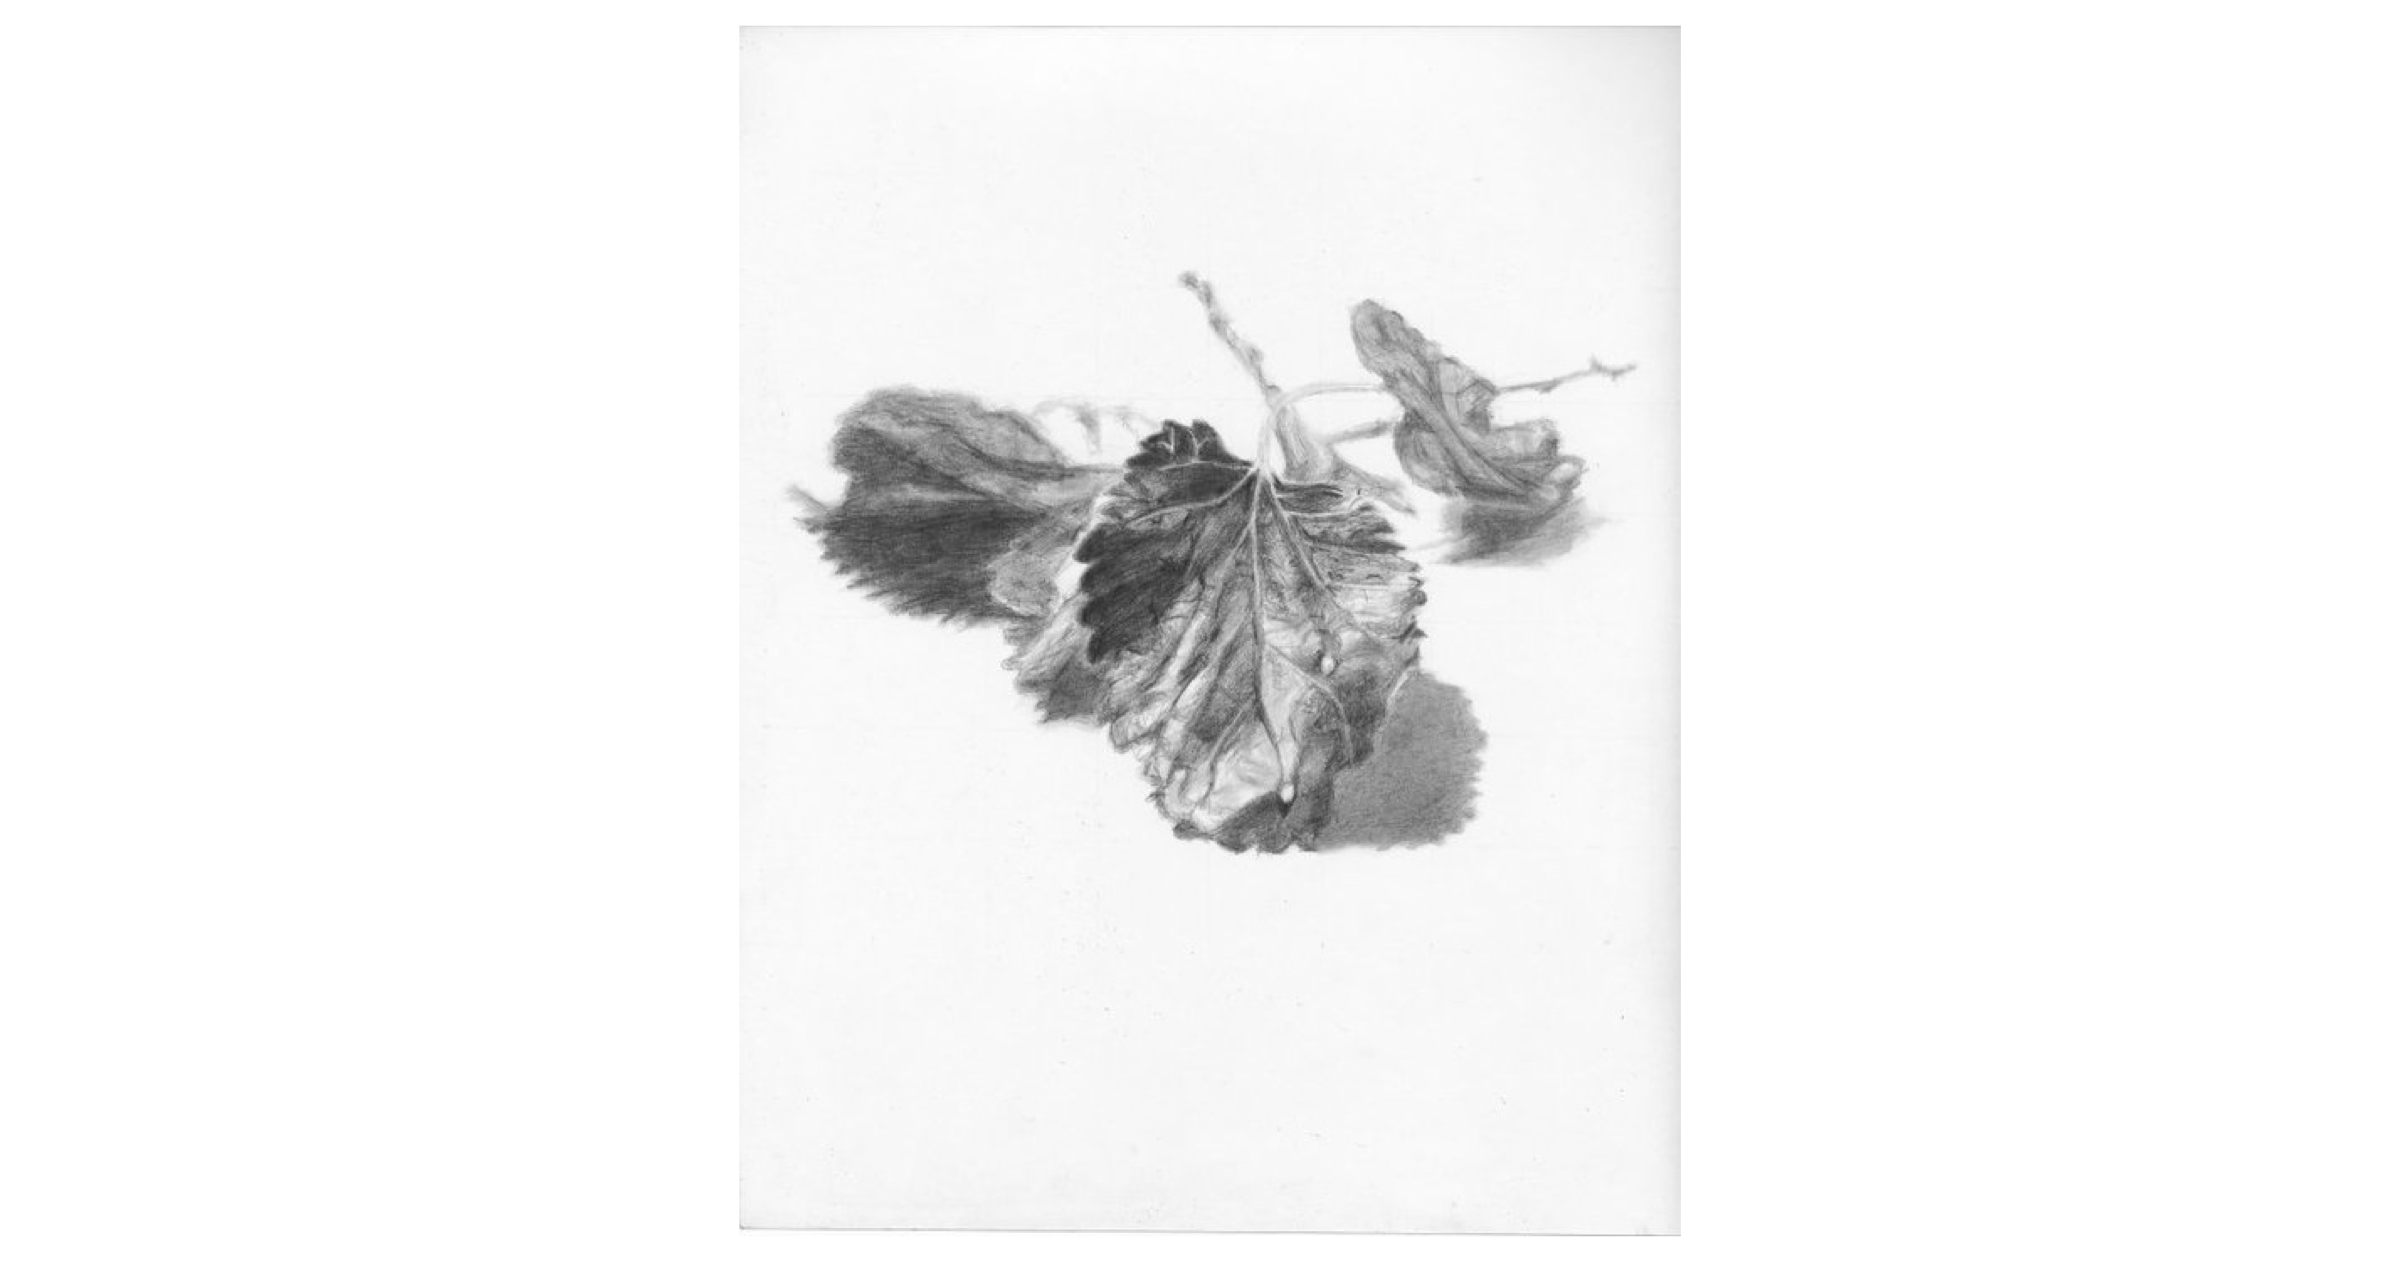
I use sketching as either a group exercise or an independent brainstorming exercise for reaching the best solution. Any designer will tell you that sketching is valuable for the exercise's ability to reach innovative solutions on paper. Designers use sketching to communicate their initial designs, and on every assignment I'm given I find sketching a helpful practice.
User Flow
User flows are a pivotal part of the design process for considering the full flow of the experience and how the user will move from point A to point B. User flows provide practical structuring for the design that can be circulated amongst product managers, engineers, and designers alike.
Wireframing
The result of the above design processes brings me to wireframing, which is the culmination of all of the steps we have taken in the design research methods above. Wireframes are accompanied by technical annotations in which I detail the exact specifications in which both developers and product managers can reference when building from stories. Wireframes are the communication tool amongst team members for both the intermediary and final designs.

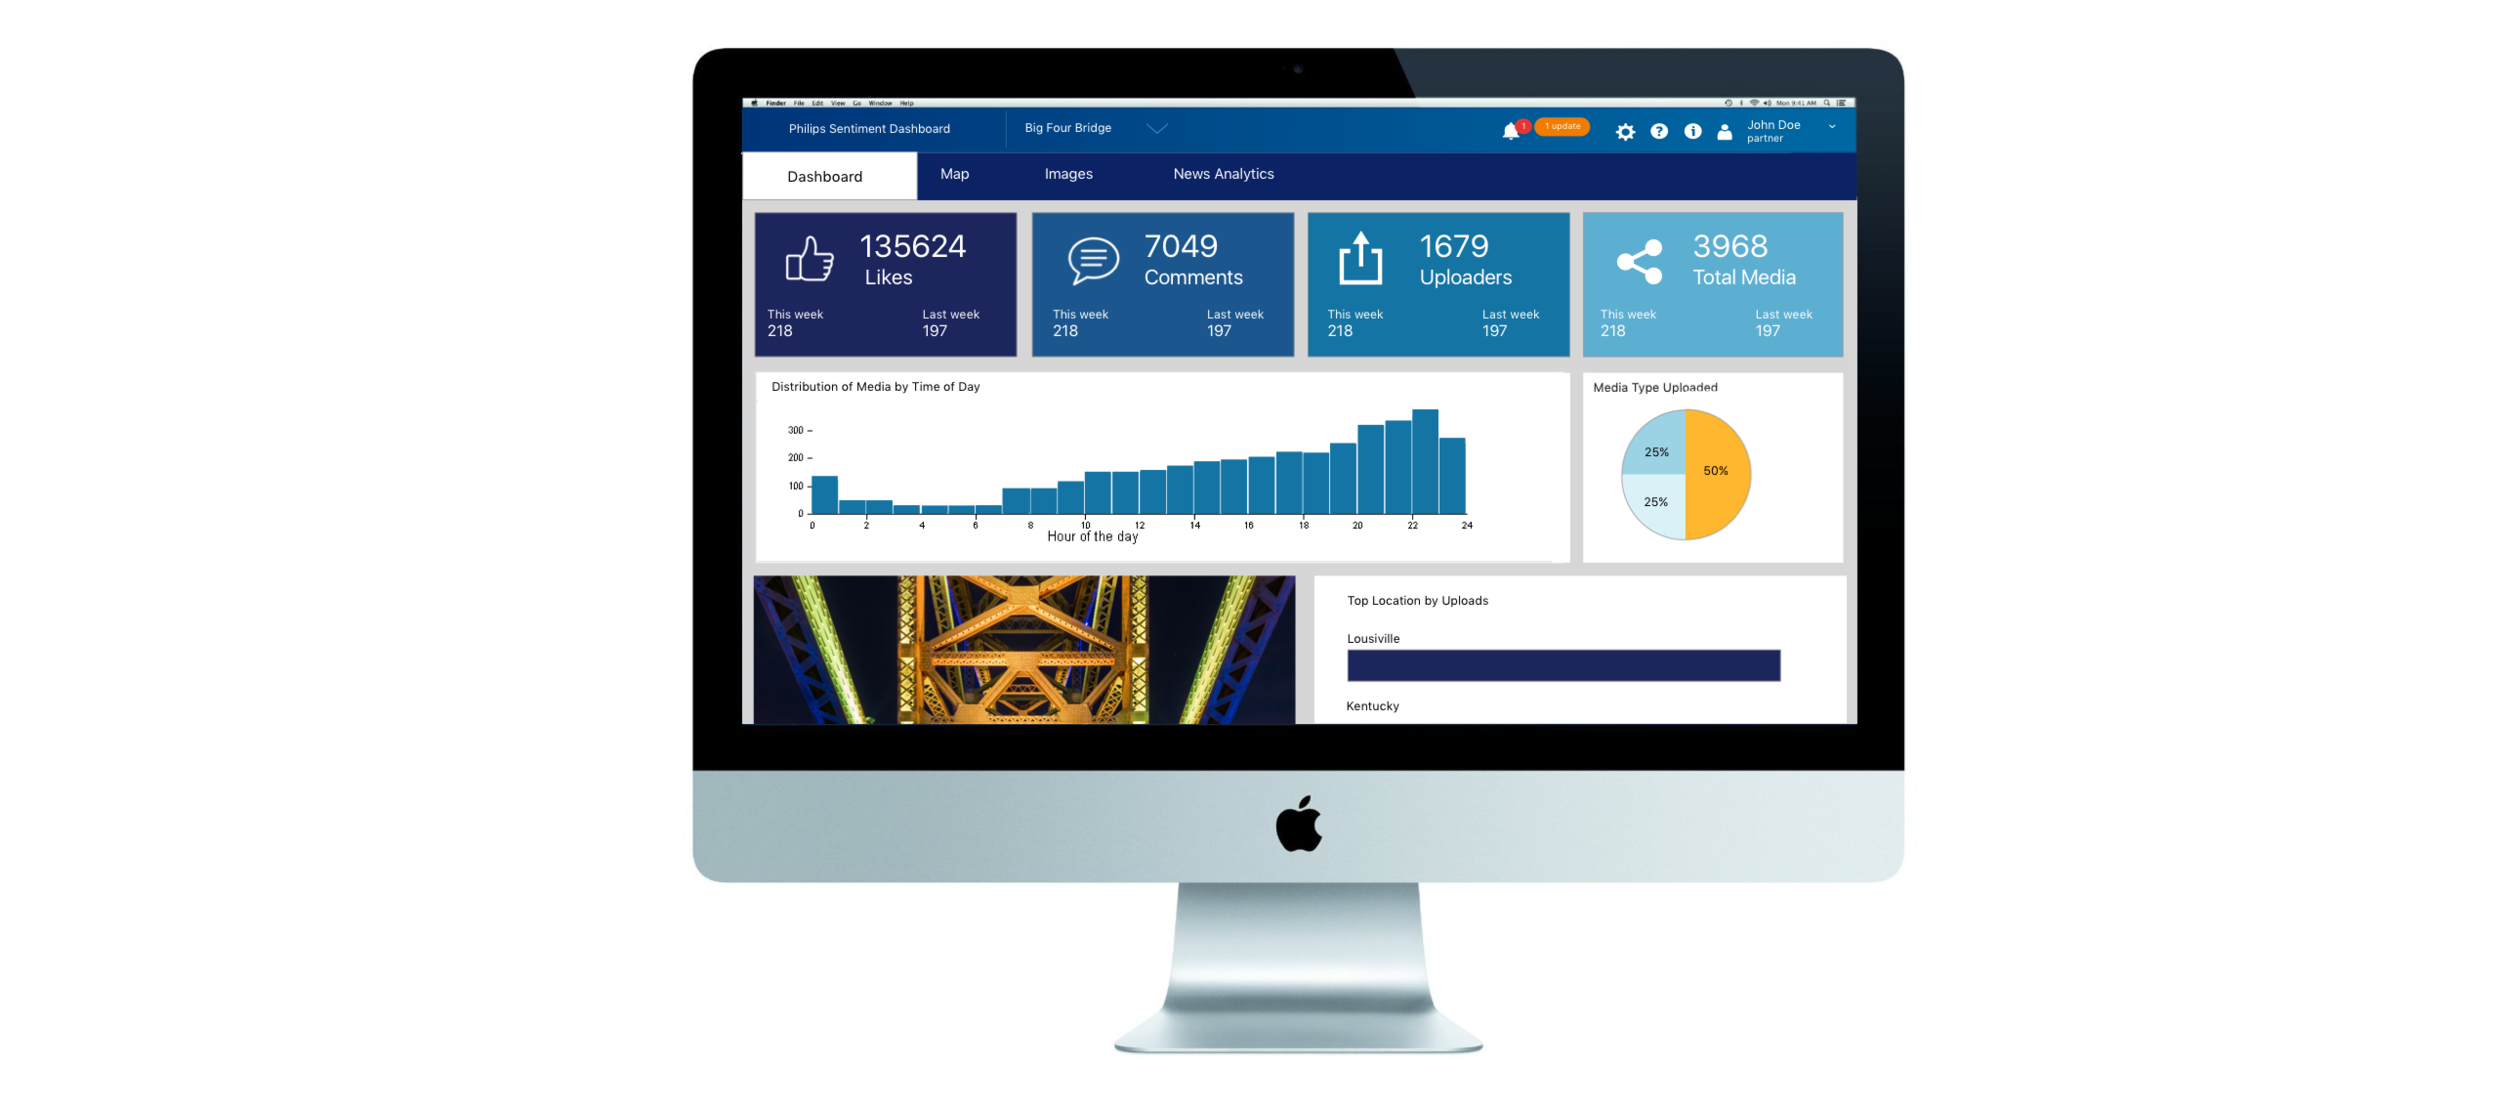
On the Dashboard page, customers view the social media analytics aggregated about their lighted structure, such as number of likes, number of uploads, number of comments, and the location of where this image was uploaded. The most popular image of the lighted structure is located on the bottom left as indicated by activity on Instagram. In this wireframe, the Big Four Bridge in Louisville, Kentucky is used as the case study to demonstrate how analytics will be pulled into support major insights about the lighted structure.

On the Map page the map indicates on hover where a picture has been taken and tagged on Instagram. Customers find value in this page for the visual representation of where their lighted structure is most popular. The clusters of blue dots indicate where an image has been uploaded on Instagram by a viewer of the structure.

The images page depicts the most popular images of the lighted structure on Instagram. the most popular image is determined by the numerical amount of likes, views, and comments of an image aggregated on Instagram. This page solves the customer pain-point of providing users more information that they were before blind to about their work and its impact on viewers.
Conclusion & Next Steps
This project was handed off in May 2017 in order to help advance the development of the Sentiment Dashboard at Philips Research. These wires will be used to create the final design that is put into production by the development team as overseen by the project manager.


